
 I spend a great deal of time managing data moving through the office. One of my regular duties is to ensure the accuracy of design vs field construction layout. I use formatted Point Styles to speed up my inspection time.
Point Group
Anyone who survived my Autodesk University 2011 class knows that Point Groups are king when dealing with data, and use them for everything. In this example I added all the incoming check locations that the crew’s automated stake out application generated into a separate Point Group to a) catalog the data, and b) to control it’s appearance independently.
Point Style
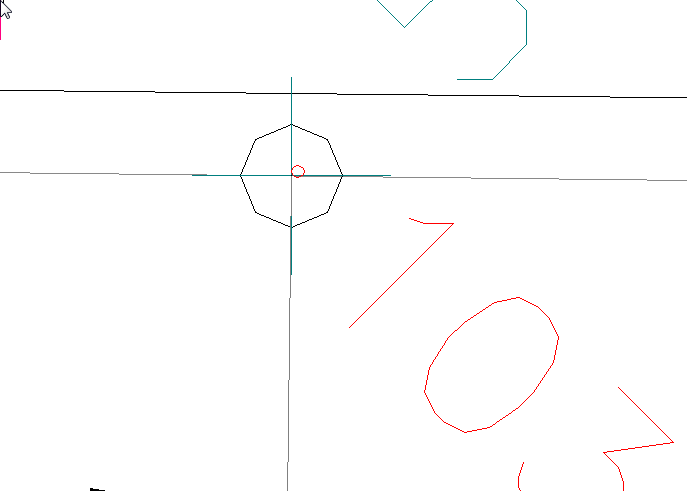
 I keep a Point Style in my template for horizontal tolerance checking. The size is set to ‘Use size in absolute units’ and the value is set to my allowable tolerance. The Marker is set to the OEM circle.
Use
When the ‘tolerance’ style is applied to the Point Group Marker Style, the check locations highlight and give a clear picture of how well the stakeout was established.
Rocket Science this is not, but it is a handy tip that I find very useful to speed up my daily grind.


Very interesting, John, But I fail to understand why the rocket scientists at Autodesk have not included a report generating feature in the software for mathematical horizontal & vertical tolerance checking. If I understand it correctly your method provides a visual tolerance check but if you want a numerical check for each point set out in the field, there is a fair amount of time involved. Tolerance checking is of utmost importance.
Thanks for the comment. The only way I could think to leverage C3D is in Survey Networks. What we did at a past company was to write an app that did the field check hor and vert. It made things soooo easy, but relied upon the crews to relocate everything with the exact same point number in a separate file. We are using the automated recollects, and as a result have less control over the point numbers. I wonder if we could program the collectors to offset the recollect range so as to be numbered coincidently parallel to the staked number. hmmmm.
In any case I could rewrite the code to sniff out apparently common points in 2 separate groups, and report the point and misses, and disregard if the point names were not identical. Would you be interested in that?
Our procedure is to have our field crews set out the points, then collect the points in a separate file using the original point numbers. We have a great stand alone survey software package that will process the fieldbook file and provide a report displaying the diff. in northings, eastings and elevation between the tied in points and the design coordintes. The problem is that the software package is 25 years+/- old and does not have any graphics associated with it. In order to use it we are constantly writing out an ascii coordinate file from C3D (or LDD) and importing it into this survey software. For the life of me, I will never understand why Autodesk refuses to incorporate a routine in C3D (or previously in LDD) to handle this since tolerance checking is such an important part of surveying…..there is so much more to surveying than ‘field to finish’.
I have a similar need, where I need to know how found survey monuments relate to a land parcel corners.
I finally settled on drawing a line from the parcel corner to monument point, and labeling the line with a style containing an expression that gives the difference between the starting x,y and the ending x,y.
I think there is a way to calculate the difference between the points, you can create two groups of points, one for the design drawings, and another for the field construction layout, then you can export to a xls, and calculate the difference between east, north, and elevation, and also you can create a formula, with you tolerance, and the formula can says which one of these values is under the tolerance. For the fill and cut is more easy, because you can create a surface volume and then create a label (spot elevations on grid) and highlight the values under your tolerance.
Saludos
This would however have to be ordered in some manner. We have the tool to do all this including toleranced review, reporting, etc. It however depends on ordering. Best solution is to go back into old code, and add a point by point search between 2 groups for tolerably close ( < 0.5' ) points, and evaluate, and then report. This would eliminate need for parallel ordering.
I used to tell the data collector to create a description for each staked point, and that desc would be the design pt number with a backslash preceding the number, i.e. “\2345”.
Seems like that would be an easy way for the program to find the two pts that correspond to each other.
foreach “ptnumber” find a description that equals “\ptnumber” & compare
Could there be a method where for each point tied in by the field crew and being brought in C3D, or being pointed at in the fieldbook file, the software would check the existing point file and if the coordinates exist, calculate and report the diff. in eastings, northings and elevation, automatically.
Another thing that bugs me with this software is this….when you are processing a field book file, the software does not tell you how the distance to the backsite point is checking……..this is something the guy in the office is more than mildly interested in as a check to make sure the field crew is backsiting the point they think they are backsiting.