
Last week I talked about the setup of Hydraflow Hydrographs for use when creating and using it for modeling drainages of concern. This week I’m going to talk about how to setup individual hydrographs for watersheds or drainage areas on a project site. Check out the full setup after the jump.
There are two common methods for completing a hydrology analysis; SCS and rational methods. The rational method is only recommend for sites up to 160 acres and is commonly used for storm sewer design. Rational method usually is not as conservative as the SCS WIN TR-55 Methods, meaning if your design may not be as accurate during larger storm events. In Iowa it has been a long road, but municipalities have been slowly changing their code to require the SCS WIN TR-55 Method to be used. Today I will show you how to create hydrographs with both methods.
Let’s first take a look at how to create a SCS Hydrograph. Along the right side of Hydraflow is an assortment of buttons for adding several elements to your stormwater model. The button to create a SCS hydrograph is located at the top. When you click on it, it opens a menu shown below. This menu contains several inputs that are required for SCS calculations and generating a model.
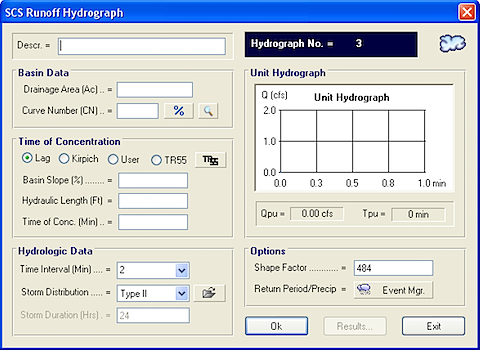
First is filling out your basin data which is the drainage area and curve number. Drainage area is pretty straight forward, its just whatever your area is for the watershed you are designing for. Curve numbers are weighted factors that represent the land use of your area. These values should be in your city/state standards, and I found an example by doing a quick google search for curve numbers. If you have several different types of land uses within your sub-watershed areas (eg. fallow row crop, and single family residential) you can further refine your curve numbers by clicking on the “%” button and input the curve numbers and drainage areas for each sub-watershed area. This should give you an accurate weighed curve number. The search button brings you to a help menu where they have some standardized values for curve numbers.
After determining your basin data, you will need to complete a time of concentration (Tc) routing. Without getting too in-depth about it, time of concentration is basically the runoff travel time. You want to typically model your watershed with the longest time of concentration, taking into account any outliers that may skew your data. Here is some great information about time of concentration. Hydraflow gives you the option of using Lag, Kirpich, User and TR55. For this example I will show how to use the TR55 method, but other methods can be used if required. Click on the TR55 button to open the menu shown below.
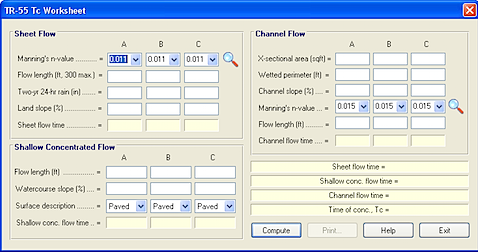
In this menu you have options for sheet, shallow concentrated, and channel flows. Typically sheet flow is for areas that would have a plane surface (lawns, parking lots, farm fields). Sheet flows distances usually max out at 300′, and most of the time I go less than that to be more conservative. Shallow concentrated flow lengths can be very long depending on how the runoff travels. Shallow concentrated flows will find “pockets” or “groves” to begin to form a “channelized” style flow. Watch shallow concentrated flows, because most likely they will turn into channel flow if its a steep ditch with a decent downhill slope. Channel flow will be things such as ditches, pipes, culverts, and open swales. If you are not familiar with time of concentration, read the information in the link above.
After determining the time of concentration I usually take a step back and look at my watershed to see if it makes sense. If you have a 300 acre watershed, you most likely won’t have a 10 minute Tc but more like a 40-50 minute Tc. For Tc’s being under 5 minutes, I will usually use the “user” input on the hydrographs menu and set a manual Tc of 5 minutes. Anything under 5 minutes is unrealistic and will skew your results.
After completing your Tc values, you need to input your Hydrologic Data and Options. Both of these have values that are preset for Hydraflow. I usually change my time interval under Hydrologic Data from 2 minutes to 1 minute to have a more accurate model. I leave the distribution model at Type II and the Shape Model at 484.
Once you have all of your data inputed, you simply can click “Ok” and then “Results” to see the data associated to your newly created hydrograph!

The rational method of creating a hydrograph is very similar. You select which method of rational you are using, standard or modified, and then input your basin data similar to the methods above. Note that the runoff coefficient is NOT the same as the curve number value you use for the SCS method. Here is another great link with information about the rational method. Once again, make sure that your city/municipal codes allow you to use the rational method before modeling with it.
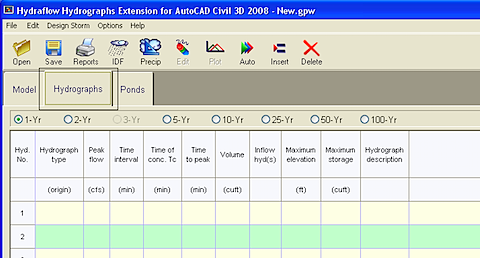
You will then see little “clouds” show up on the screen as each hydrograph. If you click on the hydrographs tab (shown above) it will list out each hydrograph in a table for easy viewing when you are switching between each different storm event. Typically when you open a saved Hydraflow model, you will have run the model again by click on the right arrow button in the top bar with the name “Auto” below it. This will insure that your model is up to date as you continue to add to your model.
If you would like anymore information on TR55 or Rational methods, and how to utilize hydrographs in other methods, please feel free to leave a comment and I will help in anyway I can.

